The Center for Weather and Climate of the National Oceanic and Atmospheric Administration (NOAA) of the US Department of Commerce published a report on Earth's climate in 2014. It is based on data from 413 scientists from 58 countries of the world, operates with data from meteorological stations and devices located on earth and in other spaces (water, ice, space), provides information on global climate indicators and important weather events. The published results speak of a clear deterioration of the ecological situation on our planet due to the ongoing global warming.
Greenhouse effect
Throughout 2014, the growth in the concentration of greenhouse gases continued, which contributed to an increase in the greenhouse effect (heating of the Earth's surface and atmosphere), and new records were set in the history of monitoring these indicators.
The concentration of carbon dioxide (CO 2 ) in the atmosphere increased by 1.9 ppm (parts per million), reaching an annual average of 397.2 ppm. For comparison: 25 years ago, in 1990, this average annual indicator was 354.0 ppm.
Record temperatures
2014 was the warmest year on record. Warming was observed in almost all regions:
- in Europe, more than 20 countries have broken their temperature records;
- the average temperature of almost all of Africa was higher than before;
- for Australia, 2014 was the third warmest year, for Argentina and Uruguay - the second, for Mexico (as well as Europe) - the first;
- only eastern North America had average annual temperatures below normal.
On average, the temperature for the year has become higher than in 1981-2010:
- on the surface of the earth - by 0.38-0.44 ° C;
- on the surface of the water - by 0.21-0.27 ° C.
To further underline the current trends in temperature on Earth, 17 of the 18 warmest years have been recorded in the last 18 years of observations.
In Russia, the winter of December-February 2013/2014 turned out to be 1.8°С warmer than the normal temperature.
Oceans and seas
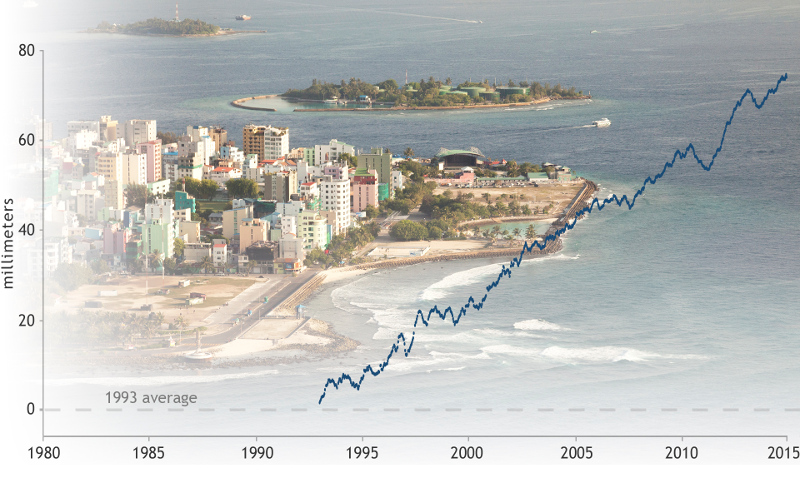
The oceans absorb more than 90 percent of the excess heat generated on Earth due to greenhouse gases. This leads to an increase in their temperatures, which set a record in 2014. This in turn contributes to rising sea levels, increased rates of glacier melt in Greenland and Antarctica, and constant stress on some marine ecosystems.
The rise in sea level in 2014 was 3.2 ± 0.4 mm, which is no different from those observed in recent years: in total, since 1993, sea level has risen by 67 millimeters. According to statistics, 8 of the 10 largest cities in the world are located near the coast, and in the United States, for example, about almost 40% of the population lives in coastal areas. The continuing trend of sea level rise is dangerous due to its potential consequences for infrastructure (flooding, destruction, spread of toxic substances, etc.), transport systems, energy production, waste disposal, wastewater and others.
Glaciers
For the North Pole (Arctic), 2014 was the fourth warmest year on record since the early 20th century. The melting of these glaciers began 20-30 days earlier than in 1998-2010. On September 17, 2014, the Arctic sea ice coverage was 1.94 million square miles, the sixth lowest recorded since 1979.
For the South Pole (Antarctica), average temperatures were in the normal range, and on September 20, 2014, ice coverage reached a record high of 7.78 million square miles. For Antarctica, this is the third year in a row that the ice cover has set new records.
The mountain glaciers of the Earth continued to decrease in 2014: the average loss was 853 mm in water equivalent (this amount of precipitation did not fall in the respective regions as a result of melting snow and ice). This figure is slightly lower than last year (887 mm in 2013), but remains one of the highest since the beginning of observations in 1980. For comparison, the average values of glacier reduction in water equivalent are:
- in the 1980s - 221 mm;
- in the 1990s - 389 mm;
- in the 2000s - 726 mm.
Other facts about the climate of 2014
- 91 tropical cyclones* were recorded, exceeding the 1981-2010 average of 82 cyclones.
- Carbon emissions from forest fires generally showed average values. Significant overshoots were seen in North America (mainly Canada) and the Indonesian archipelago, and modest reductions in emissions in South America and Africa due to reduced tropical deforestation and land use.
- The maximum river flow in the whole world turned out to be noticeably lower than in 2013. In Asia, there was a significant deficit in minimum river flow.
* Tropical cyclones occur over warm sea surfaces and are accompanied by severe thunderstorms, heavy rainfall and gale-force winds. They get their energy from lifting moist air up, condensing water vapor into rain, and lowering the drier air that results from this process down. ( Wikipedia )
Briefly about the results
2014 was a very warm year and, according to four independent data sets from researchers, the warmest year on record since 1880. The frequency of record warm temperatures has exceeded the norm in all regions except North America. The amount of greenhouse gases lingering in the atmosphere for a long time (CO 2 , CH 4 , and N 2 O) has continued to grow: the total radiative forcing has increased by 36% since 1990.
Sources:
- " International report confirms: 2014 was Earth's warmest year on record " (National Oceanic and Atmospheric Administration, noaanews.noaa.gov) .
- " 2014 State of the Climate: Highlights " (NOAA Climate.gov) .
- " State of the Climate in 2014 " (90 pages PDF; American Meteorological Society) .
See also anekdotig:
- Newsletter: " Europe's Greenhouse Gas Emissions Call for Further Cuts " (October 26, 2015)
- News: " 2015 and 2016 will be the warmest years in the history of the Planet " (September 22, 2015)